Historical data something wrong
-
@admin
@angelbroking
@administratorsany future index is valid for 3 months only
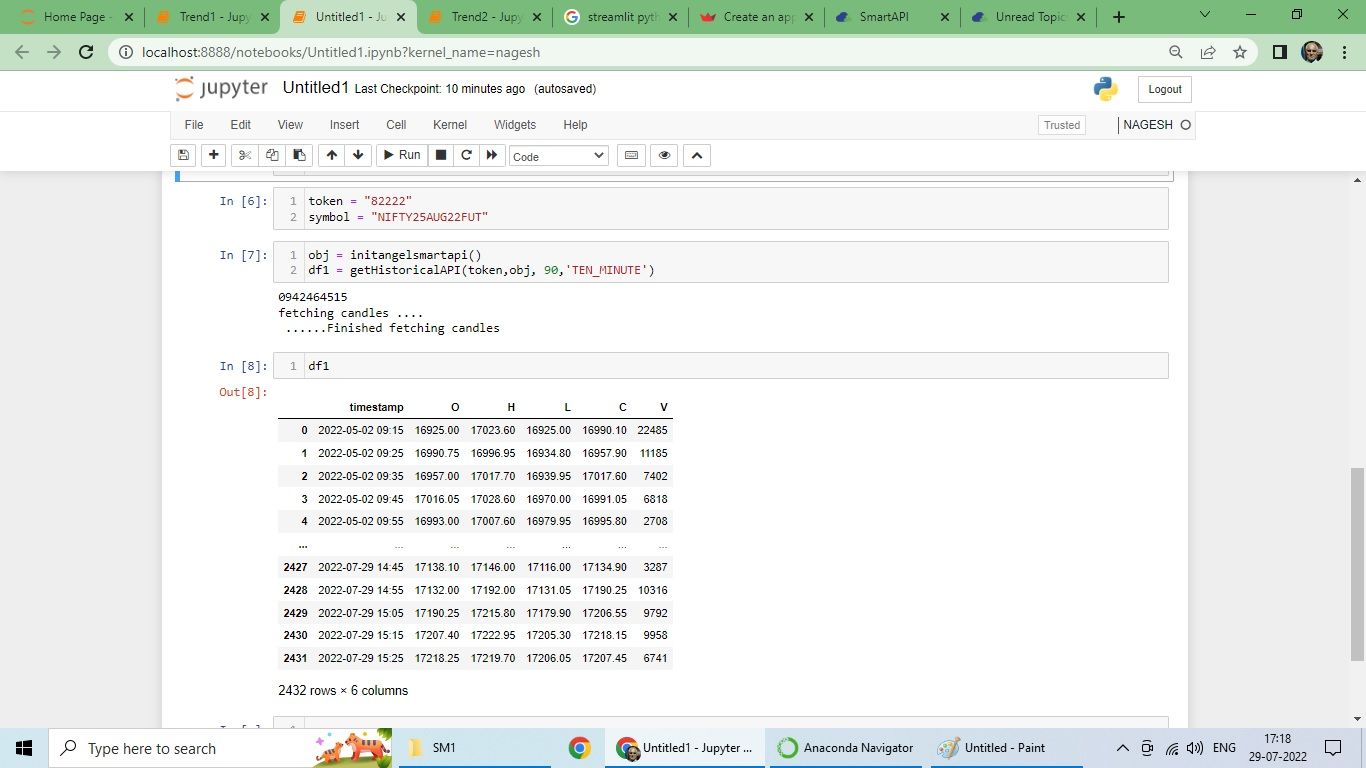
But surprisingly I am getting data for the instrument which was not there also (for the month of May 2022).
August month future should be there for the month of
June-July-August only .It is showing data for the month of May 2022 also.
(MAY-JUNE-JULY which is wrong )That means we are getting wrong data.
I was thinking at least data is good for back testing
but I feel It is not even good for back testing also.!
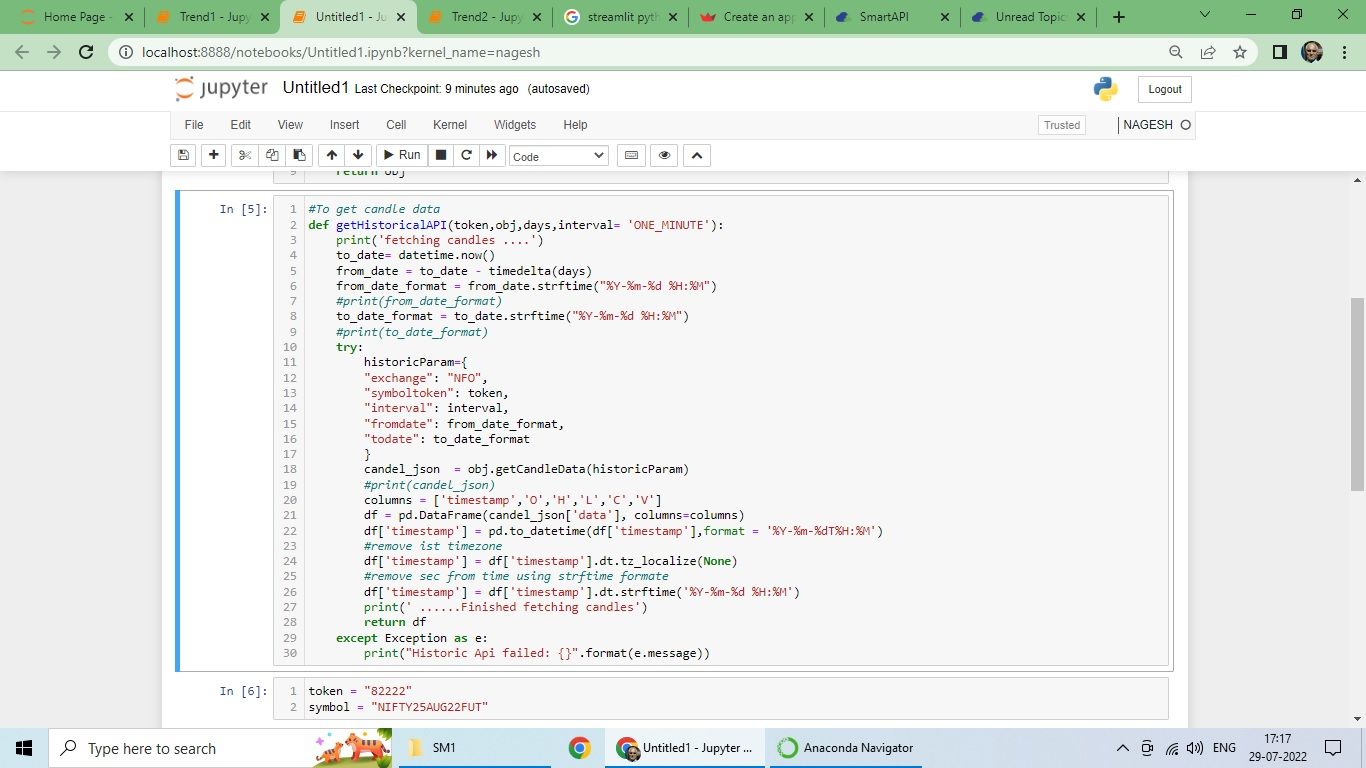
for token
token = "82222"
symbol = "NIFTY25AUG22FUT"candle
timestamp O H L C V
0 2022-05-02 09:15 16925.00 17023.60 16925.00 16990.10 22485
1 2022-05-02 09:25 16990.75 16996.95 16934.80 16957.90 11185
2 2022-05-02 09:35 16957.00 17017.70 16939.95 17017.60 7402
3 2022-05-02 09:45 17016.05 17028.60 16970.00 16991.05 6818
4 2022-05-02 09:55 16993.00 17007.60 16979.95 16995.80 2708
... ... ... ... ... ... ...
2427 2022-07-29 14:45 17138.10 17146.00 17116.00 17134.90 3287
2428 2022-07-29 14:55 17132.00 17192.00 17131.05 17190.25 10316
2429 2022-07-29 15:05 17190.25 17215.80 17179.90 17206.55 9792
2430 2022-07-29 15:15 17207.40 17222.95 17205.30 17218.15 9958
2431 2022-07-29 15:25 17218.25 17219.70 17206.05 17207.45 6741 -
@harish whatever they are providing itself is free
so suggestions or no bug reports are welcomeafter many many times i posted
finally they only told historical data is not for live trading strategies.so we should not depend on their data
-
@admin Volume in charts and volume we get in Smart api are not same, in charts if we see volume of 50,000 in 5min candle we see volume of 800 in smartapi. The difference between volume fetched in smartapi is incorrect, i have verified it with different platforms Angel One charts, Global data feed(premium data) and Tradingview all values are same but in smart api the volume has a very large difference.
-
@harish said in Historical data something wrong:
Even volume in Index futures is showing wrong on chart we see volume of 20,000- 60,000 in 5min candle but in OHLCV we get highest volume itself is less than 8000. And average volume is less than 1500. I have checked volume change in Bid -Ask, in Angel charts, Trading view charts all show higher volumes.
Can you please share more details about the same?
-
@Mnagesh said in Historical data something wrong:
But surprisingly I am getting data for the instrument which was not there also (for the month of May 2022).
hi @Mnagesh , it is the most sought after feature for futures historical data. Using current month symbol token you can derive the information even for expired contracts to do the backtesting.
-
@harish
the instrument which is not there in the month of May 2022 How it shows candle data for that ? -
@admin @angelbroking @administrators
Even volume in Index futures is showing wrong on chart we see volume of 20,000- 60,000 in 5min candle but in OHLCV we get highest volume itself is less than 8000. And average volume is less than 1500. I have checked volume change in Bid -Ask, in Angel charts, Trading view charts all show higher volumes.
Request to kindly check and fix this issue. Accurate volume is very important for many strategies. All these days we have used wrong values and tested our strategy, kindly check this at the earliest.
Thanks
Harish -